CAVAL
Module:
Retail Buying
Year:
2023
For this project, I was tasked to create a seasonal merchandise assortment taking into account market trends and consumer demands and formulate merchandising mathematics such as OTB plans for a mockup brand that I conceptualized with. I also was required to do sales forecasting and developed a profitable plan and merchandise assortments.
BRAND CONCEPT
CONSUMER PROFILE

Age: 22- 38
Occupation: Office workers, businessmen
He is someone who is classy and courteous. He is known to be a perfectionist and is highly respected in his occupation. People around him see him as charismatic and a hard worker. He could be single or dating. He is someone who is attentive and appreciates quality and value. He prefers coffee and tea and red wine over beer. He is high maintenance and regularly grooms himself. In his free time, he likes to read the news or lifestyle genres or go for a jog, His apartment is neatly organized with classic furniture such as a leather couch. He may seem intimidating at first but in reality, he is passionate and understanding.
.png)
ASSOCIATED BRANDS:
BRAND POSITIONING
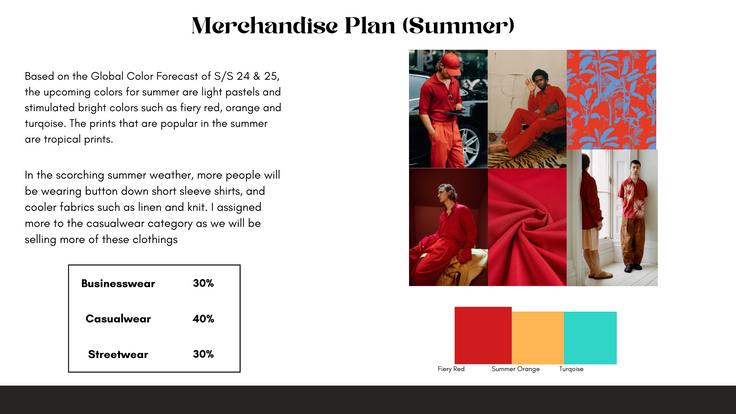
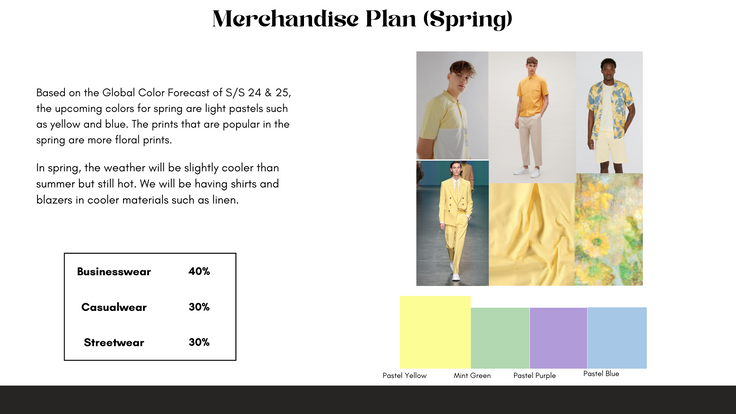
MERCHANDISE PLAN
MERCHANDISE SHEET
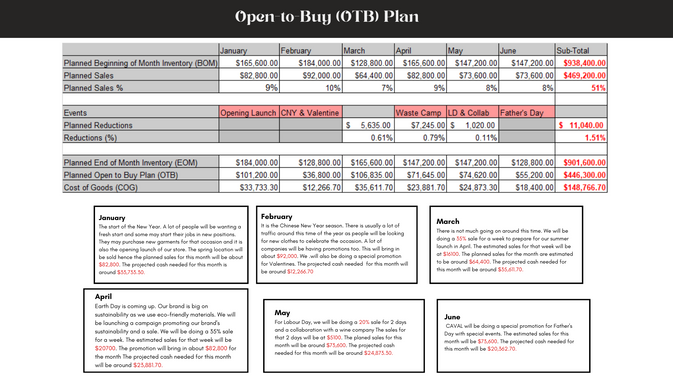
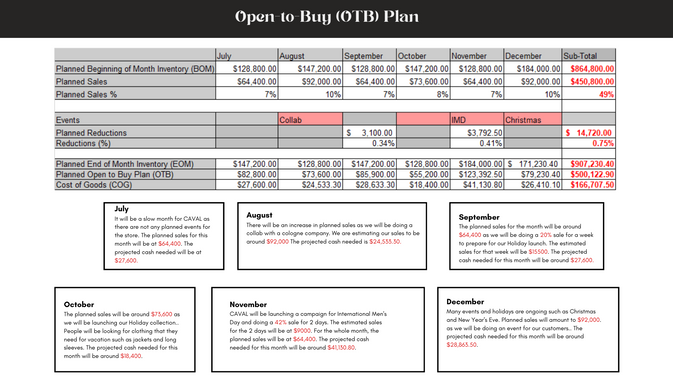
OPEN TO BUY(OTB) PLAN
My total planned sales for the year were set at $920,000. This number is reasonable for my brand as CAVAL is a high-end menswear brand. On the fashion cycle, our products are expected to last a longer time. A typical blazer costs about $160 while a shirt costs about $90. Our brand also uses high-quality materials and has a big sustainability presence. Our stock-to-sales ratio is set at 2 as our products are around the mid-range price. With this, I distributed the planned sales around the months and split my Open-to-Buy plan into 2 parts. My markup for my products is set at 3x.
The EOM of December was calculated by estimating the market growth rate of the following year. I estimated that the menswear sector will increase by 3.4%. I then calculated it by taking the BOM of January which is $165,600 and multiplying it by 103.4%.
$147,200 x 103.4% = $171,230.40

OTB EXPLANATIONS
GANTT CHART

MARKETING MOCKUPS
For this project, according to the gantt chart, I also had to create mockups such as posters for the events that I plan to hold. These are the posters and website mockups that I have designed and created.


